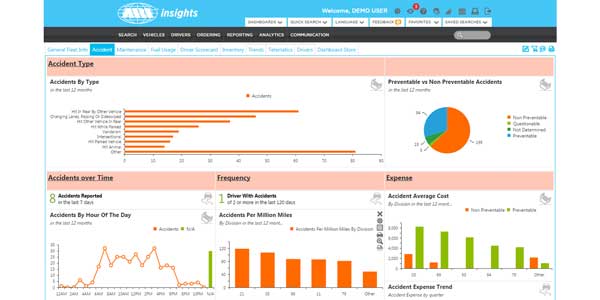
ARI has unveiled a new Accident Dashboard in its ARI insights portal, designed to allow fleet managers to easily see the impact accidents have had on a company’s bottom line and identify trends and patterns that might suggest additional training is needed or other changes should be made in order to prevent accidents.
Available to current ARI clients in the United States and Canada on the ARI Accident Management program, the Accident Dashboard details accident-related data across an entire fleet through charts and graphs. Accidents can be examined by day of the week and time of day, all over a 12 month period, helping fleet managers identify potentially at-risk time periods. Fleet managers can also identify drivers with multiple incidents, the average cost per incident, and much more. In total, the dashboard contains 14 metrics to monitor, analyze and take action on accident claim information, the company explained.
“With accident data presented this way, we believe fleet managers are able to understand the trends behind accidents in their fleets and will be able to better determine what actions can be taken to minimize accidents, and what driver safety training needs to be assigned as a result,” said Tony Candeloro, ARI’s vice president of product development and client information services.
The Accident Dashboard also gives fleet managers the ability to fairly compare accident rates among different divisions, since it is able to determine the number of claims per million miles driven. Accident Dashboard also tracks the costs associated with each accident, so users can identify the average and total cost for preventable and non-preventable accidents by division and can plot that information to see the trend over the past five quarters.