Glance around your office and tell me if this sounds right: The room is stuffed with stacks of service documents and hand-written notes, whiteboards covered in ink, a few filing cabinets filled with years of archives, and a desktop computer with folders full of Excel sheets. To the untrained eye it’s a daunting, unorganized jungle of information, but for you, it’s the sum of your fleet’s service-related knowledge—and you know where to find every detail about what’s going on with the trucks in your fleet.
So when someone tries to convince you to start using digital service dashboards to collect and organize your data, you’ve never been interested. Your system works for you, and you can’t imagine how long it would take to learn the complexities of a new piece of software.
If this sounds familiar, know this: service dashboards are much more than a simple organizational tool. They’re your key to improving your fleet’s ROI and vehicle uptime, and can give you the confidence to know that your trucks are running in tip-top shape, not to mention the super-human ability to know when something’s about to go wrong before it actually does.
Interested? Then start with this guide to getting started with service dashboards.
It’s your data—and you’re missing out on it
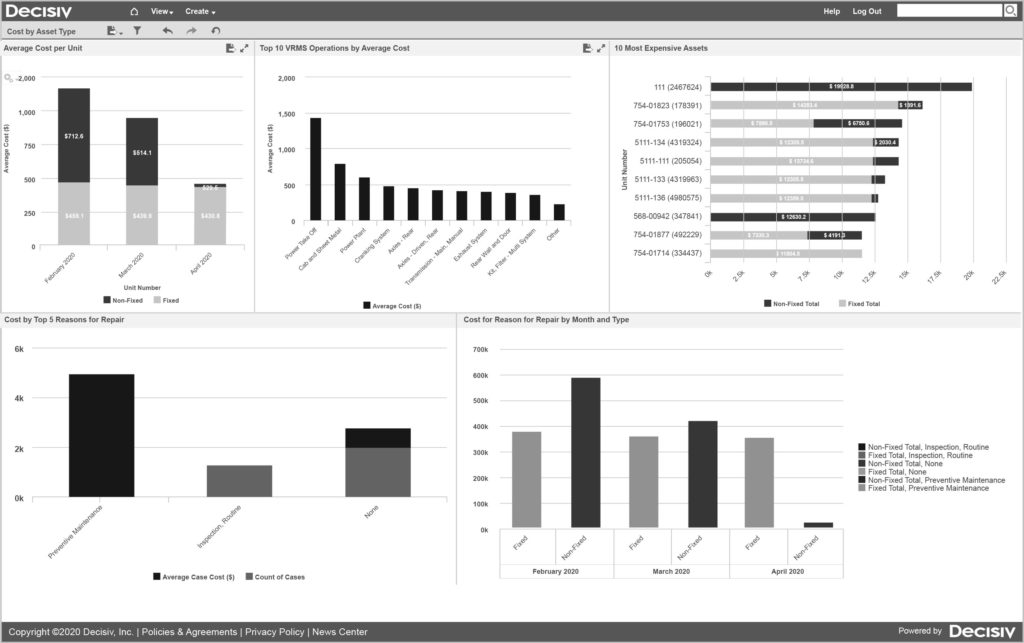
A fleet manager relying on pen and paper or digital spreadsheets is limiting her ability to make rapid decisions in real time using the most up-to-date data available, explains Pete Russo, senior vice president of product innovation and strategy for Decisiv, a provider of service relationship management solutions for fleets.
“A service dashboard can be instrumental in effectively managing vehicle uptime,” Russo says. “It provides multiple ways by user role to view service information to easily understand what is going on with the fleet’s vehicles, get automated alerts on actions that need to be taken, make better and faster decisions and gain historical insights for improving service programs that drive vehicle uptime.”
And, he says, dashboards are designed to be updated automatically, as opposed to paper or spreadsheets which are generally updated after the work is finished and already documented in the source system.
James Griffin, chief operating officer and chief technology officer of Fleet Advantage, a business intelligence firm that works as a consultant for fleets, adds that the data accuracy and security benefits of service dashboard use should not be overlooked.
“Spreadsheets can be copied, edited, unintentionally modified and corrupted, but dashboards create standards and agreed-upon Key Performance Indicators (KPIs) for monitoring and reporting,” Griffin says. “Service dashboards provide a single source of truth sourced from a protected database. This assures everyone is working from the same data. Dashboards can also be hosted in the cloud, thus providing business continuity, availability and enhanced security.”
What’s your first step?
All fleets operate slightly differently and rely on a diverse set of KPIs and metrics to make decisions. Fleet Advantage’s Griffin explains that a fleet should start by collectively determining what KPIs and metrics are essential to their operation. Only then should you reach out to your IT or solutions partner to kick off the project.
“If you start transitioning and creating without definition, you have no real direction and will not generate buy-in from stakeholders because they will see no value in the change,” Griffin says. “This will obviously slow momentum and support and further frustrate the stakeholders.”
Decisiv’s Russo says this “needs assessment” phase can be broken down into answering just four questions:
- Why do you want/need a services dashboard?
- What questions would you like the dashboard to answer for you?
- What would you like to see in the dashboard?
- Where does your data come from?
Russo walks through a few examples:
- Why do you want/need a services dashboard? “This could be as simple as you want something easier to maintain or more accurate and up-to-date than your current paper, whiteboard or spreadsheet approach. It could be there is information or analysis you need that you can’t get or manage via current manual methods,” Russo says. “Ideally, you can tie your needs back to business objectives. Maybe it will help you save time and money by being able to make critical decisions quicker, or it will help improve service team efficiency, or it will improve PM currency, and so on.”
- What questions would you like the dashboard to answer for you? If you have a service-related question, chances are the dashboard has the answers at the click of a button. Russo says you might have work-in-progress (WIP) questions like “how many units are down right now,” “what is the status of my downed units,” or “do I have any estimates waiting for approval?” Or service performance questions like “what is my unit utilization,” “what is my PM currency,” “what is my average number of repairs between PMs,” or “what are my top three safety/PM inspection failures?” Or vehicle health questions like “which units have critical faults,” “what are my top 10 faults by frequency,” or “which are my highest cost vehicles with the most downtime?” These are all common questions for a service dashboard to answer.
- What would you like to see in the dashboard? “This may be as simple as showing your IT or solutions partner how you manage today on a paper, whiteboard or spreadsheet, or how you’d really like to see information if you could easily manipulate it,” Russo says. “Generally speaking, it’s identifying what you want to see as rows in a table or as ‘cards’ in a process flow (typical for a WIP dashboard), or as graphs and charts (typical for a service performance dashboard), or as pins on a map (typical for a vehicle health dashboard).”
- Where does your data come from? “Maybe you look up data in a system or have to get it from your service team, or you pull it from some report, or you have to log in to a vendor portal,” Russo says. “Knowing where it comes from will help your IT or solutions partner figure out how to get the data from the source systems in an automated way.”
Find the right style of dashboard for you
Now that you’ve done your homework, there’s just one step left before your dashboard can start saving you time and churning out valuable data. You need to choose which dashboard you’ll use. Russo breaks your options into five categories depending on the size and scope of your operation.
Sources from which you can get your dashboard include:
- With service management systems (these include fleet maintenance or management systems, shop systems and service provider business systems);
- As part of telematics provider health portals;
- Via OEM, provider and contract maintenance portals;
- As enterprise reporting and business intelligence (BI) tools and systems;
- As aggregated data from multiple sources in a service relationship management (SRM) ecosystem platform.
Types 1, 2 and 3, Russo explains, generally operate in a data silo, meaning the dashboard uses data gathered from your own fleet or a particular telematics provider.
“Service management system dashboards are best with data within the fleet or shop or service provider,” he says. “If your scope is limited to your own shops and/or one service provider, this may be sufficient for you.”
If you want to aggregate data from your own shops and multiple telematics providers, as well as multiple OEM, component providers and service networks, Russo says there are multiple ways this can be achieved. You could choose to work with multiple dashboards of type 1, 2 and 3, or develop integrations with all these source systems and build your own dashboard (type 4).
“Needless to say, type 4 can require substantial IT expertise, resources, risk and time,” Russo says.
There is another way to aggregate this data, represented by a type 5 dashboard: An SRM ecosystem platform that already integrates with and aggregates data from multiple sources. The advantage here is that ecosystem platforms have data interfaces that allow you to pull the aggregated data into your own BI tools or systems for further analytics, without having to build integrations into each of the source systems, Russo explains.
“You get the benefit of the connectivity that is integral and essential in the ecosystem’s design,” he says. “Such platforms are always evolving as well, future-proofing your implementation with new data sources and new analytics, AI and machine learning capabilities.”
Fleet Advantage’s Griffin says that making this decision should involve all of the departmental representatives in your company, and recommends involving them early in the process to create buy-in and value in your system.
“The transition process needs to be well-defined and communicated in the beginning stages with progress communicated often,” Griffin says. “Components will change as you go through the process; new discoveries and ideas will require evaluation. If there is a decision to alter the process and/or timelines, these need to be clearly communicated and explained. Initial buy-in is critical for the successful launch.”
Getting the most out of your new dashboard(s)
Now that you’ve chosen the right solution for your fleet and can make better and faster service decisions, now’s the time to double down and teach your team how to best take advantage of your new-found data resource.
Griffin says it’s important to garner support and momentum early on, and to keep the initial scope of the platform small, but meaningful.
“Do not try to boil the ocean from the outset. Part of the plan needs to include sufficient training for the new platform,” Griffin says. “Once the transition is complete, the ongoing monitoring and open dialogue will continue to enhance the platform.”
“Rip off the Band-Aid,” Russo adds. “Integrate the dashboard into your service process so you and others on your team are using it every day, speaking the same language, sharing insights and working together to keep the data accurate and up to date. Run your meetings with it, and cut off your team’s use of paper and spreadsheets.”
Click here to find out how to know that the data your dashboards is providing is accurate, and click here for a service dashboard use case.