To maintain swift operations, one of the most essential parts of a fleet manager’s role is evaluating the operational metrics and equipment trends that help determine the circumstances under which problems are occurring. Having access to the numbers doesn’t act as a standalone solution. Everyone has piles of data, but it’s how the data is interpreted and, more importantly, what is done in response to improve the forward trajectory of fleet performance.
Understanding the data is easier said than done. Not only can it be hard to ingest the mass amounts of data you’re likely receiving, but trying to interpret it comes with its own set of time-consuming headaches.
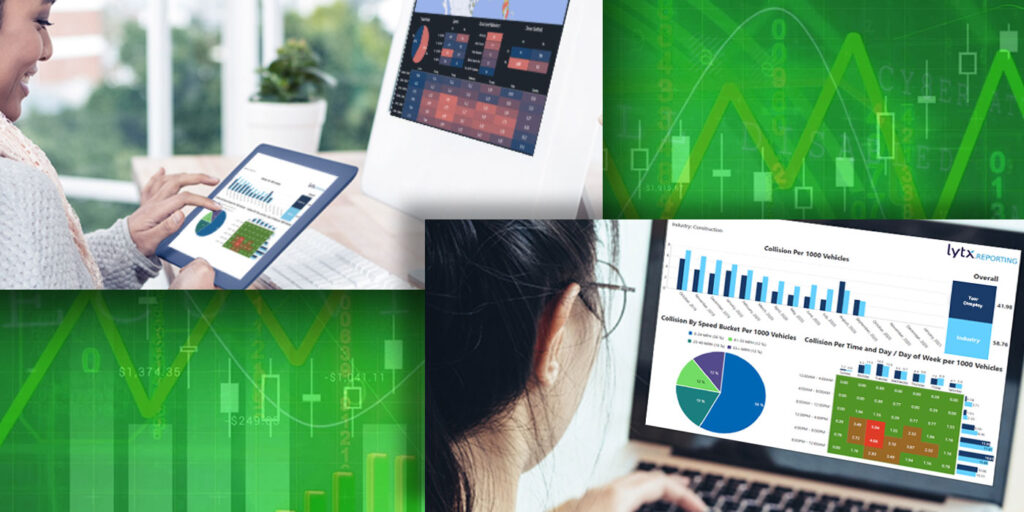
Lytx, a telematics and fleet management service provider, is helping managers put fleet performance into perspective and allowing for a broader view of driver behavior to help clients better understand driving events, issues or overall productivity.
Fleet Equipment spoke with Erin Baucum, director of client intelligence, Lytx, who was eager to share some of the latest features of their new powerful industry tool available to all of their clients at no additional cost – The Lytx Intel Portal. This platform analyzes a vast database and presents three customized dashboard reports.
FE: How does this enhance the services already available to your clients?
Baucum: Clients have a lot of insights directly through our analytics account today. This is an extension of that. It’s a service that we want to provide customers who want a deeper level of analysis. It’s a tool that will help them improve their performance and also understand the factors impacting it.
FE: What will the additional data allow clients to do?
Baucum: One of the questions that we get from customers is, ‘How am I truly performing? I can see my risk, but are we as a company doing well or not?’ Providing comparisons to how industry peers are trending allows them to answer these questions and know what is working well within their fleets and what they need to focus on.
FE: What are the different reports you offer to clients?
Baucum: We have three industry reports today that are published to the Portal.
The first one is the Collision Dashboard. We look at both a fleet’s and the industry’s total collision count per 1,000 active devices and trend it over 15 months. Clients are also able to access collisions by speed and collision frequency by time and day. Assessing all of this data in one view can help a fleet understand if their trends are ‘normal’ for the industry, and further assess factors potentially impacting safe driving or riskier driving that ultimately result in collisions. Our most successful customers will put this data into action by creating campaigns or incentives to reduce risky driving patterns.
The second powerful report that we offer is the Industry Collision Insights focusing on industry level collision insights over the recent three months. This report includes environmental and driving factors surrounding collision events, to provide the fuller context of what is occurring. The data is broken down into four parts:
1. Collision heat map: Geospatial heatmap of collision frequency.
2. Collision breakdown: Analyzes different collision categories such as speed, seat belt usage and driver behavior.
3. Time and day: By analyzing data from the previous three months, the map offers the time and days collisions occurred.
4. Additional Insight: Breaks down collisions based on possible preventability, collision type, weather, traffic conditions and collision severity
The behavior report is the third and most recent report launched. This one’s really exciting because it clicks down into what is happening inside the cab. It takes the most prevalent driver behaviors that the company cares about and compares it to the same behaviors over the entire industry to help managers see how they are performing relative to industry peers. Furthermore, this report offers a view of the different types of technology fleets have enabled to capture behaviors. From this, fleets can evaluate their own mix of technology vs that of the industry to help in assessing whether or not they’d like to capture more risk.
FE: What is next for the portal?
Baucum: Time will tell! Our team values and responds to client feedback so future reports will be rooted in that. There is a feedback option in the portal and gathering more information about which insights are most valuable and actionable for fleets will inform our future development activities.