Since the program was launched in 2004, a fleet joining the SmartWay Partnership has agreed to several things. Among these have been to regularly report vehicle-related data on its fleet operations and allow the score resulting from a proprietary SmartWay calculation to be posted on the SmartWay website.
These scores indicate the relative fuel efficiency and environmental performance of the program’s fleet Partners, but do not detail the various techniques used because some fleets consider such information to be proprietary. The scores, however, are based on the fuel saving strategies—and, therefore emissions reducing strategies—the fleets used. Under the system, SmartWay used the data fleets provided to calculate the average benefit for incorporating operational strategies known to save fuel; for example, reducing top road speed from 70 to 60 MPH or launching an idling-reduction program.
Also included was credit for utilizing fuel saving components, such as:
• Using a direct-fired cab heater gave fleets a credit for fuel savings of 0.78 gal./hr. compared to low idle.
• The use of an APU resulted in a credit of 0.6 gal./hr. compared to low idle.
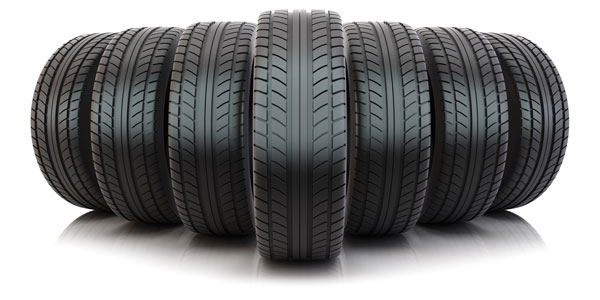
• Using wide single tires gave fleets a credit for fuel savings of 4%.
• Complete trailer aerodynamic devices gave the fleet a credit of 5%.
• The installation of automatic tire inflation systems gave the fleet a credit for fuel savings of 0.6%.
Since part of a fleet’s commitment to the program is to report operational data annually, Partners have been able to improve their scores by adopting various fuel-efficiency and emission control technologies, policies and strategies for their fleets. A score of 1.25, the highest score available in the present scoring system, represents outstanding environmental performance. Partners achieving such a score would already be utilizing most of the commercially available fuel saving strategies and are actively evaluating the latest emerging technologies. These Partners are rewarded with the ability of displaying the SmartWay Transport Partner logo, EPA’s symbol for superior fuel efficiency and environmental performance.
A score of 1.00 represents very good fuel saving and environmental performance and is above the industry standard. A score of 0.75 represents good environmental performance and is the most common Partner score. Since all Partners are committed to improving their environmental performance, SmartWay believes that all of its Partners, regardless of their score, are going above and beyond freight companies not participating in the program.
The SmartWay scoring strategy has served its intended purpose for the last five years, but some fleet managers believed it fell short of doing all that it could. For example, Royal Jones, president and CEO of Las Cruces, N.M.-based MVT, the fleet featured in this column last month, said that he would like to see the SmartWay score based on miles-per-gallon because he believed he would easily outrank his peers in squeezing the most mileage out of each gallon of diesel fuel he burns in his fleet.
Mr. Jones will shortly get his wish, according to Matt Paine, a SmartWay Transport Partnership engineer and the lead on designing what is referred to in EPA as the new SmartWay 2.0. SmartWay is currently changing some of the data it collects from its industry Partners in a move to change its ranking and reporting to one based on actual performance. He said, “Under 2.0 what we’re really looking at is bottom line performance that will be expressed in three main metrics:
• Grams per mile
• Grams per payload ton-mile
• Grams per volume-mile.”
Each of these parameters will be measured for three emission compounds: CO2, NOx and particulate matter. This will result in nine parameters expressed in a 3×3 matrix.
Editor’s note: More information on SmartWay’s new scoring system and what it will mean for Partner fleets will be presented in this column next month.